
Join Lazina, in part 2 of the Renesas DA14592 tutorial series as she explores advanced tools like the SmartSnippets Toolbox and Power Profiler.
Learn how to monitor and optimize power consumption to design high-performance, energy-efficient devices using the DA14592 Bluetooth LE solution.
Click here for part 1
Related products:
See the video or read the full transcript below.
Toggle transcript
Welcome back to Part 2 of our tutorial on Renesas’ DA14592! I’m Lazina, a Technical Marketing Engineer at Future Electronics. In this video, we’ll explore advanced tools and techniques to unlock the full potential of the DA14592, including the SmartSnippets Toolbox and the Power Profiler. These tools will help you monitor and optimize power consumption, making it easier to design energy-efficient, high-performance devices. Let’s dive right in!
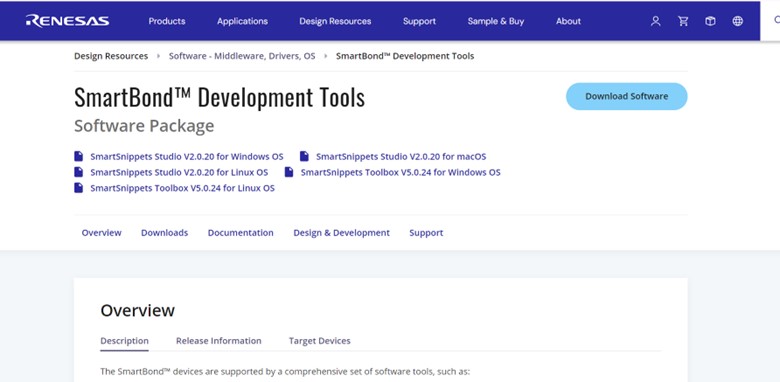
To prepare for the next demo, we’ll need to download the SmartSnippets™ Toolbox from Renesas’ website. This tool helps with programming eFLASH, optimizing power performance, analyzing power profiles and helps with regulatory testing with the RF monitor. A key feature, the Power Profiler, allows real-time monitoring of battery current draw and charge via USB, and calculates total energy consumption during specific code execution.
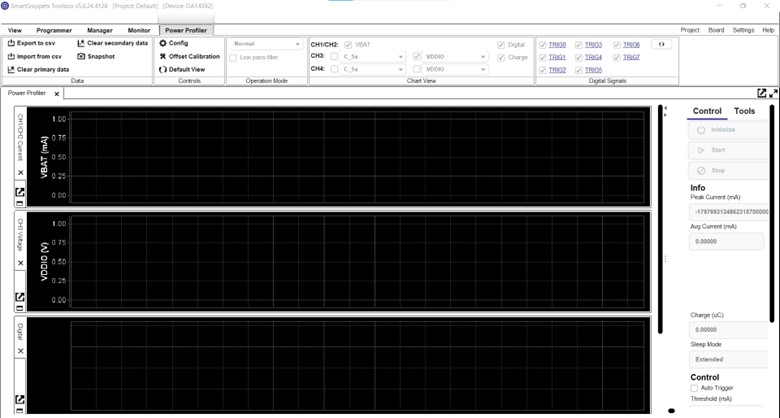
After the installation process is complete, launch the SmartSnippets Toolbox. You’ll be greeted with a window like so:
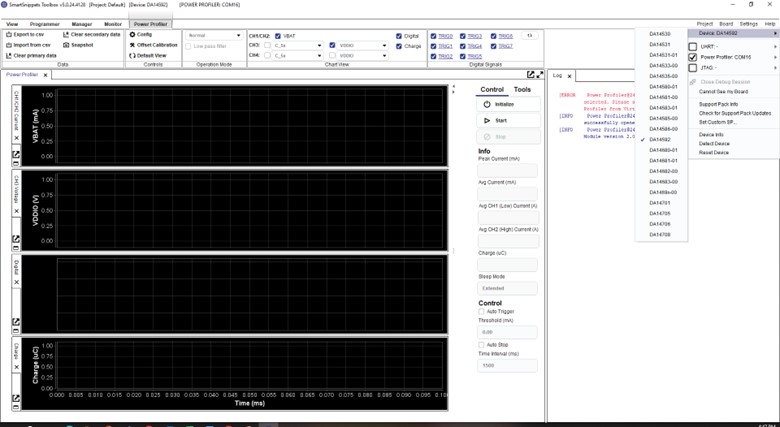
To connect to our board, navigate to the top ribbon and select Board, then under Device select the DA14592 for our kit, and then the Power profiler should already have the COM Port enumerated.
Next, we need to navigate to the Power Profiler, which is accessed through the Monitor tab, then Power Profiler. This will open the Power Profiler interface, where we can configure the settings for power monitoring.
Before we start taking measurements, we need to perform a calibration to verify and adjust the accuracy of the module’s readings by comparing them to reference measurements. The circuit accuracy is measured by applying a constant current, monitoring the same current with an external instrument and the ADC of the PMM2 module, then comparing the two. In general, the inaccuracy presented in the current measurement circuit is less than 5 % (practically less than 2 %) in most of the current range.
The steps to calibrate are:
- Connect the motherboard to the PC.
- Remove the daughter board so that it does not dissipate any power. Alternatively, power off the daughterboard via the daughterboard power switch (the motherboard should still be powered on).
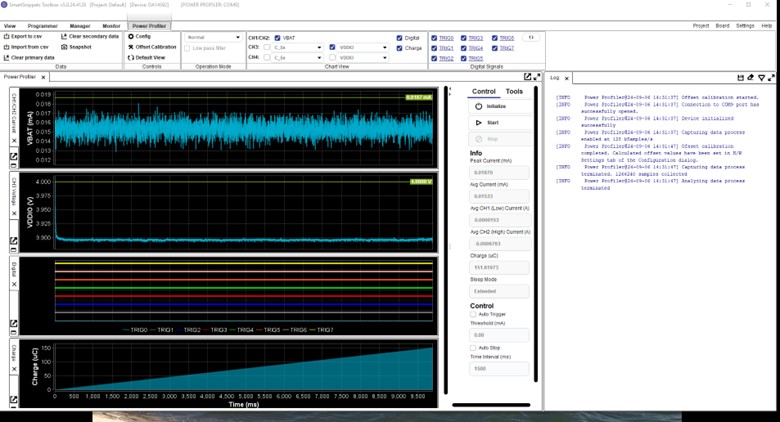
- Press the initialize button from the Control toolbar of Power Profiler tool to detect the PMM version.
- Press the Offset Calibration button from the Controls group of the ribbon. Data will be collected for about 10 seconds and then will automatically stop.
- Then select start.
- Check the value displayed on the Avg Current (mA) field. This is the current introduced by the motherboard that we would like to subtract from subsequent measurements.
- The average current (in mA) is multiplied by -1 and set as the calibration offset in the Power Profiler configuration. This negative offset is expected because, for PMM1, the offset is added to the measured current, so using a negative value corrects the measurement.
- Connect (or alternatively switch on) the daughter board and follow the normal procedure for taking measurements.
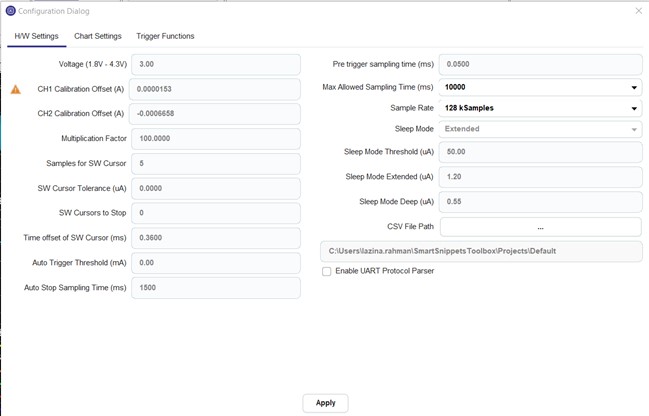
Now that we’ve completed calibrating, we can move forward. Using the Power Profiler, we can adjust the sampling frequency and voltage measurement range based on system requirements, balancing detail with load, and matching the expected power characteristics.
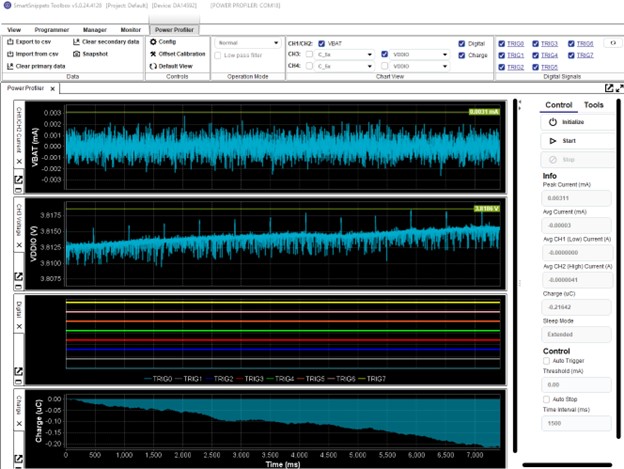
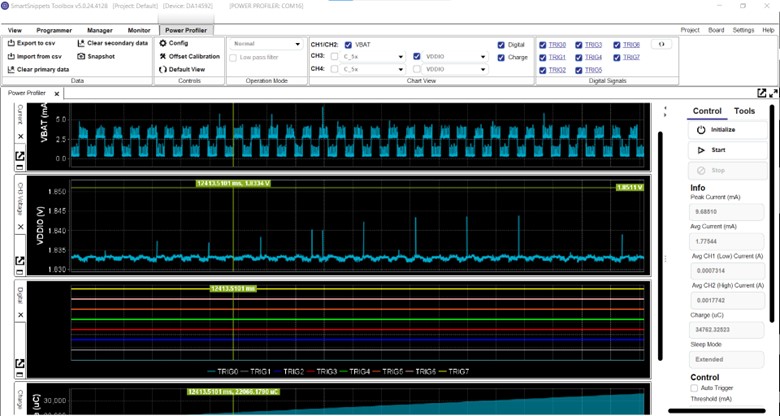
And now the fun part! Select “start” to begin collecting power consumption data. The profiler will capture real-time information about the power usage of your embedded system.
As the profiler runs, the real-time graphs will display current, voltage, and energy usage trends. You can observe how different sections of your code impact power consumption. In our case, this is what the power consumption is of the PXP reporter.
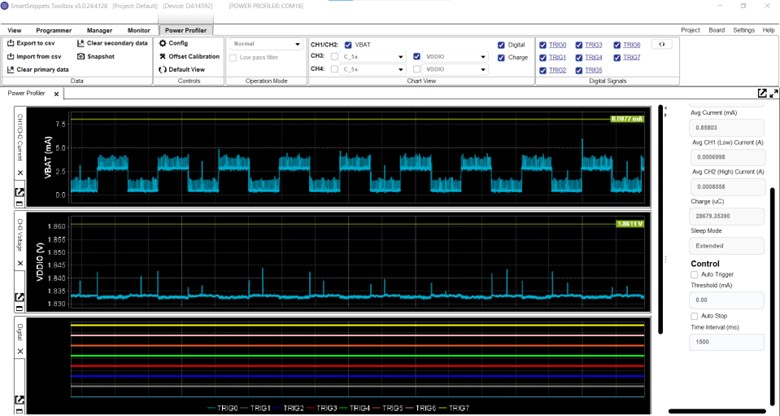
For fun, I connected back to the smartBond app and set the immediate alert to mid, this is what the power consumption looks like:
We can use the graphing tools to zoom in and out, focus on specific events, and study power consumption over time.
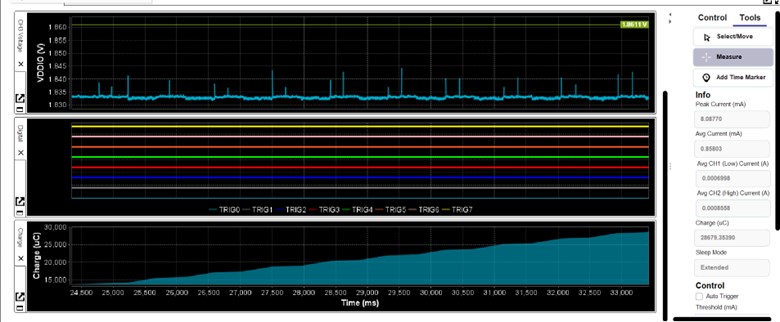
Use markers to annotate key events in your application’s lifecycle, this helps you understand how specific actions affect power usage. You can also use it to correlate code execution phases with power consumption peaks.
Once you’ve captured enough data, click Stop to end the power profiling session.
When you have finished collecting data, you can export the power data as a CSV file for further analysis in external tools. Use it to analyze idle states, measure power consumption in sleep modes or idle states to optimize battery life.
Now you know how to get started with the DA14592 Pro kit from Renesas.
If you’d like more information, please feel free to reach out to your local Future Electronics representative or visit us online at futureelectronics.com.
Thanks for watching, and I’ll catch you next time on Techventures with Lazina!